January 2011
Revised November 2020
Revised November 2021
Revised July 2024
Revised August 2024
NEW: See the new measurements of sound cards and Softrock below..
Software defined radios often use an analog quadrature mixer to convert RF to "baseband"; that is, to a lower frequency that can be sampled by a PC sound card. The mixer produces two outputs that have equal amplitude, but that differ in phase by 90 degrees. This is sampled by the left and right inputs of the PC sound card. Subsequent processing in the PC filters and demodulates the signal, and results in radio sound output. Examples of such radios are the SoftRock series, the early FlexRadio products and Direct to Baseband UHF radios.
Other software defined radios avoid analog mixers by sampling the antenna voltage directly. Subsequent processing is identical to radios based on quadrature mixers, but the mixers are digital instead of analog. Examples of this type of radio are the SDR-IQ by RfSpace, the Mercury and Hermes projects from the Open HPSDR Group, my (James Ahlstrom) SDR transceiver and the Hermes Lite 2.
Other radios use conventional mixers and crystal filters, and add digital signal processing at the IF. Examples are the K3 from Elecraft, and many other radios by leading manufacturers.
Here we are concerned with the problems that arise in radios based on analog quadrature mixers when the amplitudes of the two channels are not exactly equal, or the phases do not differ by exactly 90 degrees. These errors result in an undesired image response at the negative of the receive frequency. That is, if the radio receives a signal 10 kHz above the VFO (center frequency), the operator will see and hear a false signal 10 kHz below the center frequency. The same problem exists on transmit. If the radio VFO is 7100 kHz, and it transmits at 7110 kHz, there will be an image transmitted at 7090 kHz. Careful analog design can reduce these errors, and then a correction can be made in the software to reduce them further. For a description of the software correction see http://www.qsl.net/ik1xpv/dsp/pdf/aiqben.pdf and the pages for the various SDR softwares such as Linrad and Rocky.
Note that sound cards do not respond to DC, so we must avoid low frequencies. We must also avoid frequencies approaching half the sample rate. Frequencies above the audio spectrum must be viewed with suspicion until measurements confirm that the sound card can work at such frequencies.
It is well known that some PC sound cards have a one sample time delay between the left and right stereo channel. This introduces a frequency dependent phase shift in the I/Q data. My Quisk software has an option to delay either channel by one sample. But recently (November 2021) Chuck Ritola discovered that delays between zero and one sample are possible too. He wrote an extensive discussion with measurements that is available here. It is advisable to use a proper audio interface without these delays rather than try to compensate for them.
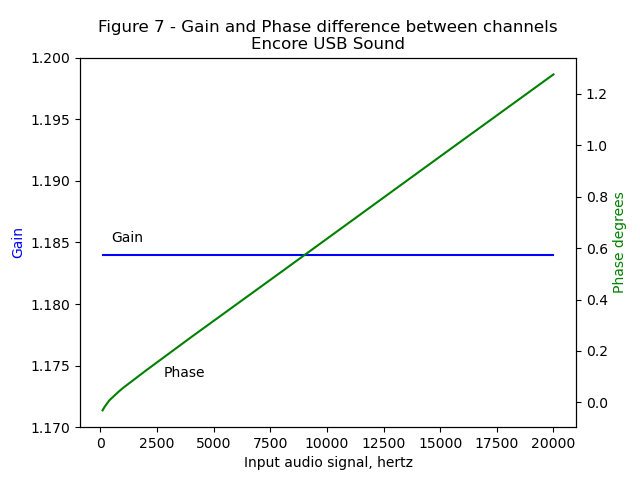
I measured the amplitude and phase difference between channels of two sound cards by connecting the left and right channels to an audio generator, preforming a DFT for each channel and comparing the amplitude and phase at the peak bin. This plot shows the results for an Encore Electronics ENMAB-8CM. The maximum phase change is 1.275 degrees. There is a linear phase change, but the calculated delay of 177 nsec is much smaller than a one sample delay of 21 microseconds. This amount of phase change is acceptable, but unfortunately this USB card has a one sample delay on transmit. Note that the phase change is different for record and play.
I also measured an old M-Audio Fast Track Pro and found a similar graph with maximum phase change of 0.33 degrees.
This was at a sample rate of 44.1 ksps. I could not change the rate to 48 ksps on this old card.
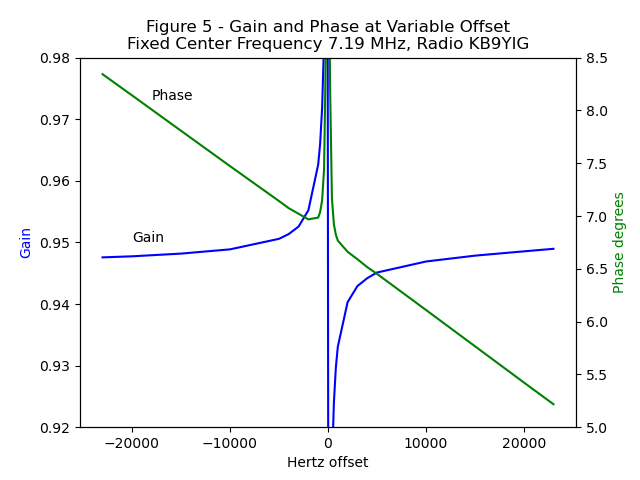
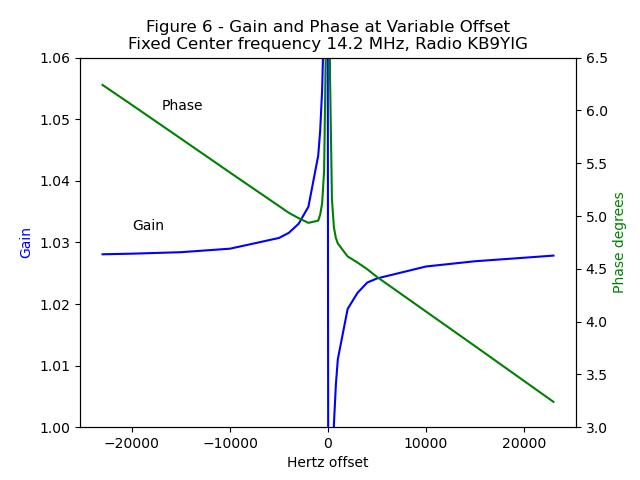
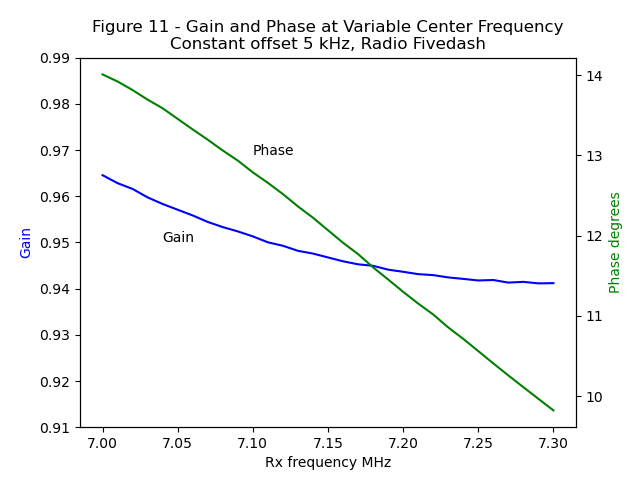
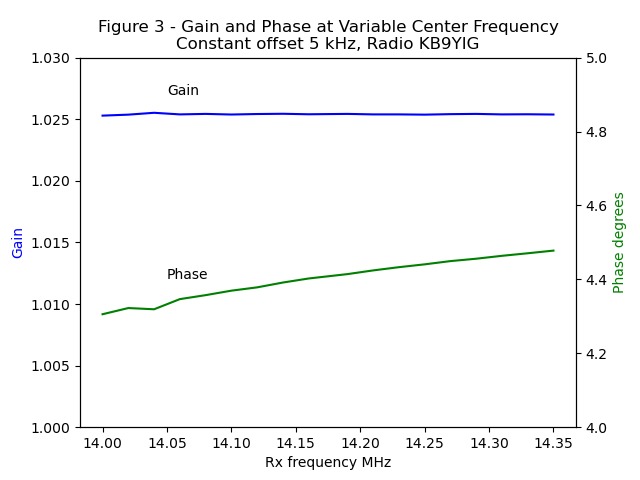
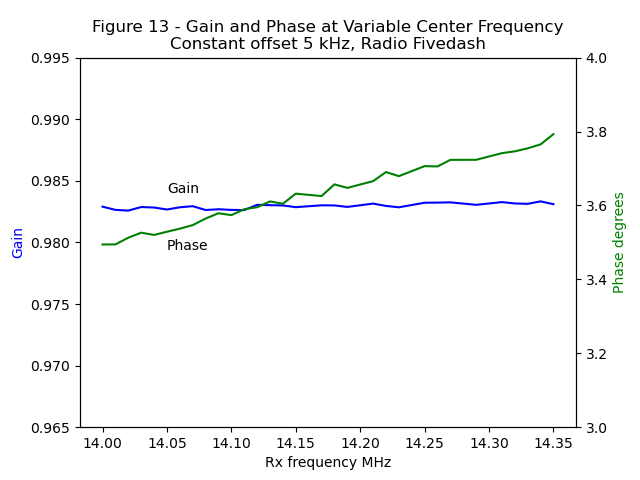
I used my Quisk software with some modifications to measure the receive performance of two Softrock RxTx Ensemble radios. One was the radio given to me by Sid Boyce (thanks again Sid) labeled "KB9YIG" and "5/24/10". The other was a more recent radio lent to me by Ben Cahil, AC2YD labeled "Fivedash". The results are similar. The first plot is the relative gain (ratio of the channel amplitudes) and phase difference for a fixed center frequency of 7.19 MHz and a variable offset from center. Note that although the sound card has flat response to below 50 hertz, the Softrock is not usable below about 500 hertz. The second graph shows the same but for 20 meters.
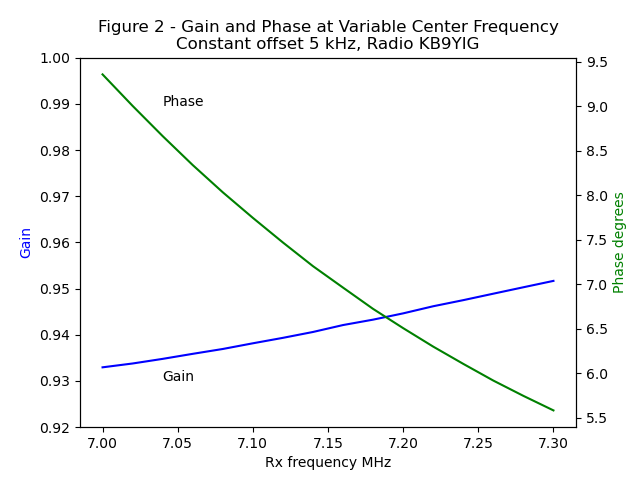
The next graph shows the gain and phase at a constant audio tune frequency of 5000 hertz while tuning across the 40 and 20 meter bands for each radio. Note that phase corrections depend on both the center frequency in the band and the offset from the center frequency. The offset is more important than the center frequency. The 20 meter performance is much better than 40 meter.
I used a SoftRock Rx/Tx Ensemble given to me by Sid Boyce (thanks Sid) together with my Quisk software to measure the Tx amplitude and phase corrections needed to null the image. I used a Siglent SSA-3032X spectrum analyzer to measure the RF output, but you could also use a second receiver tuned to the image. The sample rate for all these measurements is 48000 samples per second, There are two tuning variables, the frequency of the VFO and the tuning frequency as an offset from the VFO. For example, you could transmit a signal at 7.101 kHz by setting the VFO to 7.100 kHz and tuning to 1 kHz, or you could set the VFO to 7.090 kHz and tune to 11 kHz.
This focuses on the transmit path, but corrections must also be made to the receive path, and so a second set of corrections must be measured. The transmitter requires much better image rejection than the receiver. A 40 dB image rejection is probably OK for the receiver, but 42 dB is the minimum FCC requirement for HF in the USA. We want to do much better than that because the image will appear several kilohertz away from our signal, perhaps even outside the amateur bands.
My initial attempt to use a Behringer UCA222 as the sample source failed, and I found that I could null the image only at very low audio frequencies. It turns out that this USB sound "card" has a one sample delay between the left and right channel. Unfortunately, several common sound cards have this problem. Quisk has a setting to delay one of the channels to compensate.
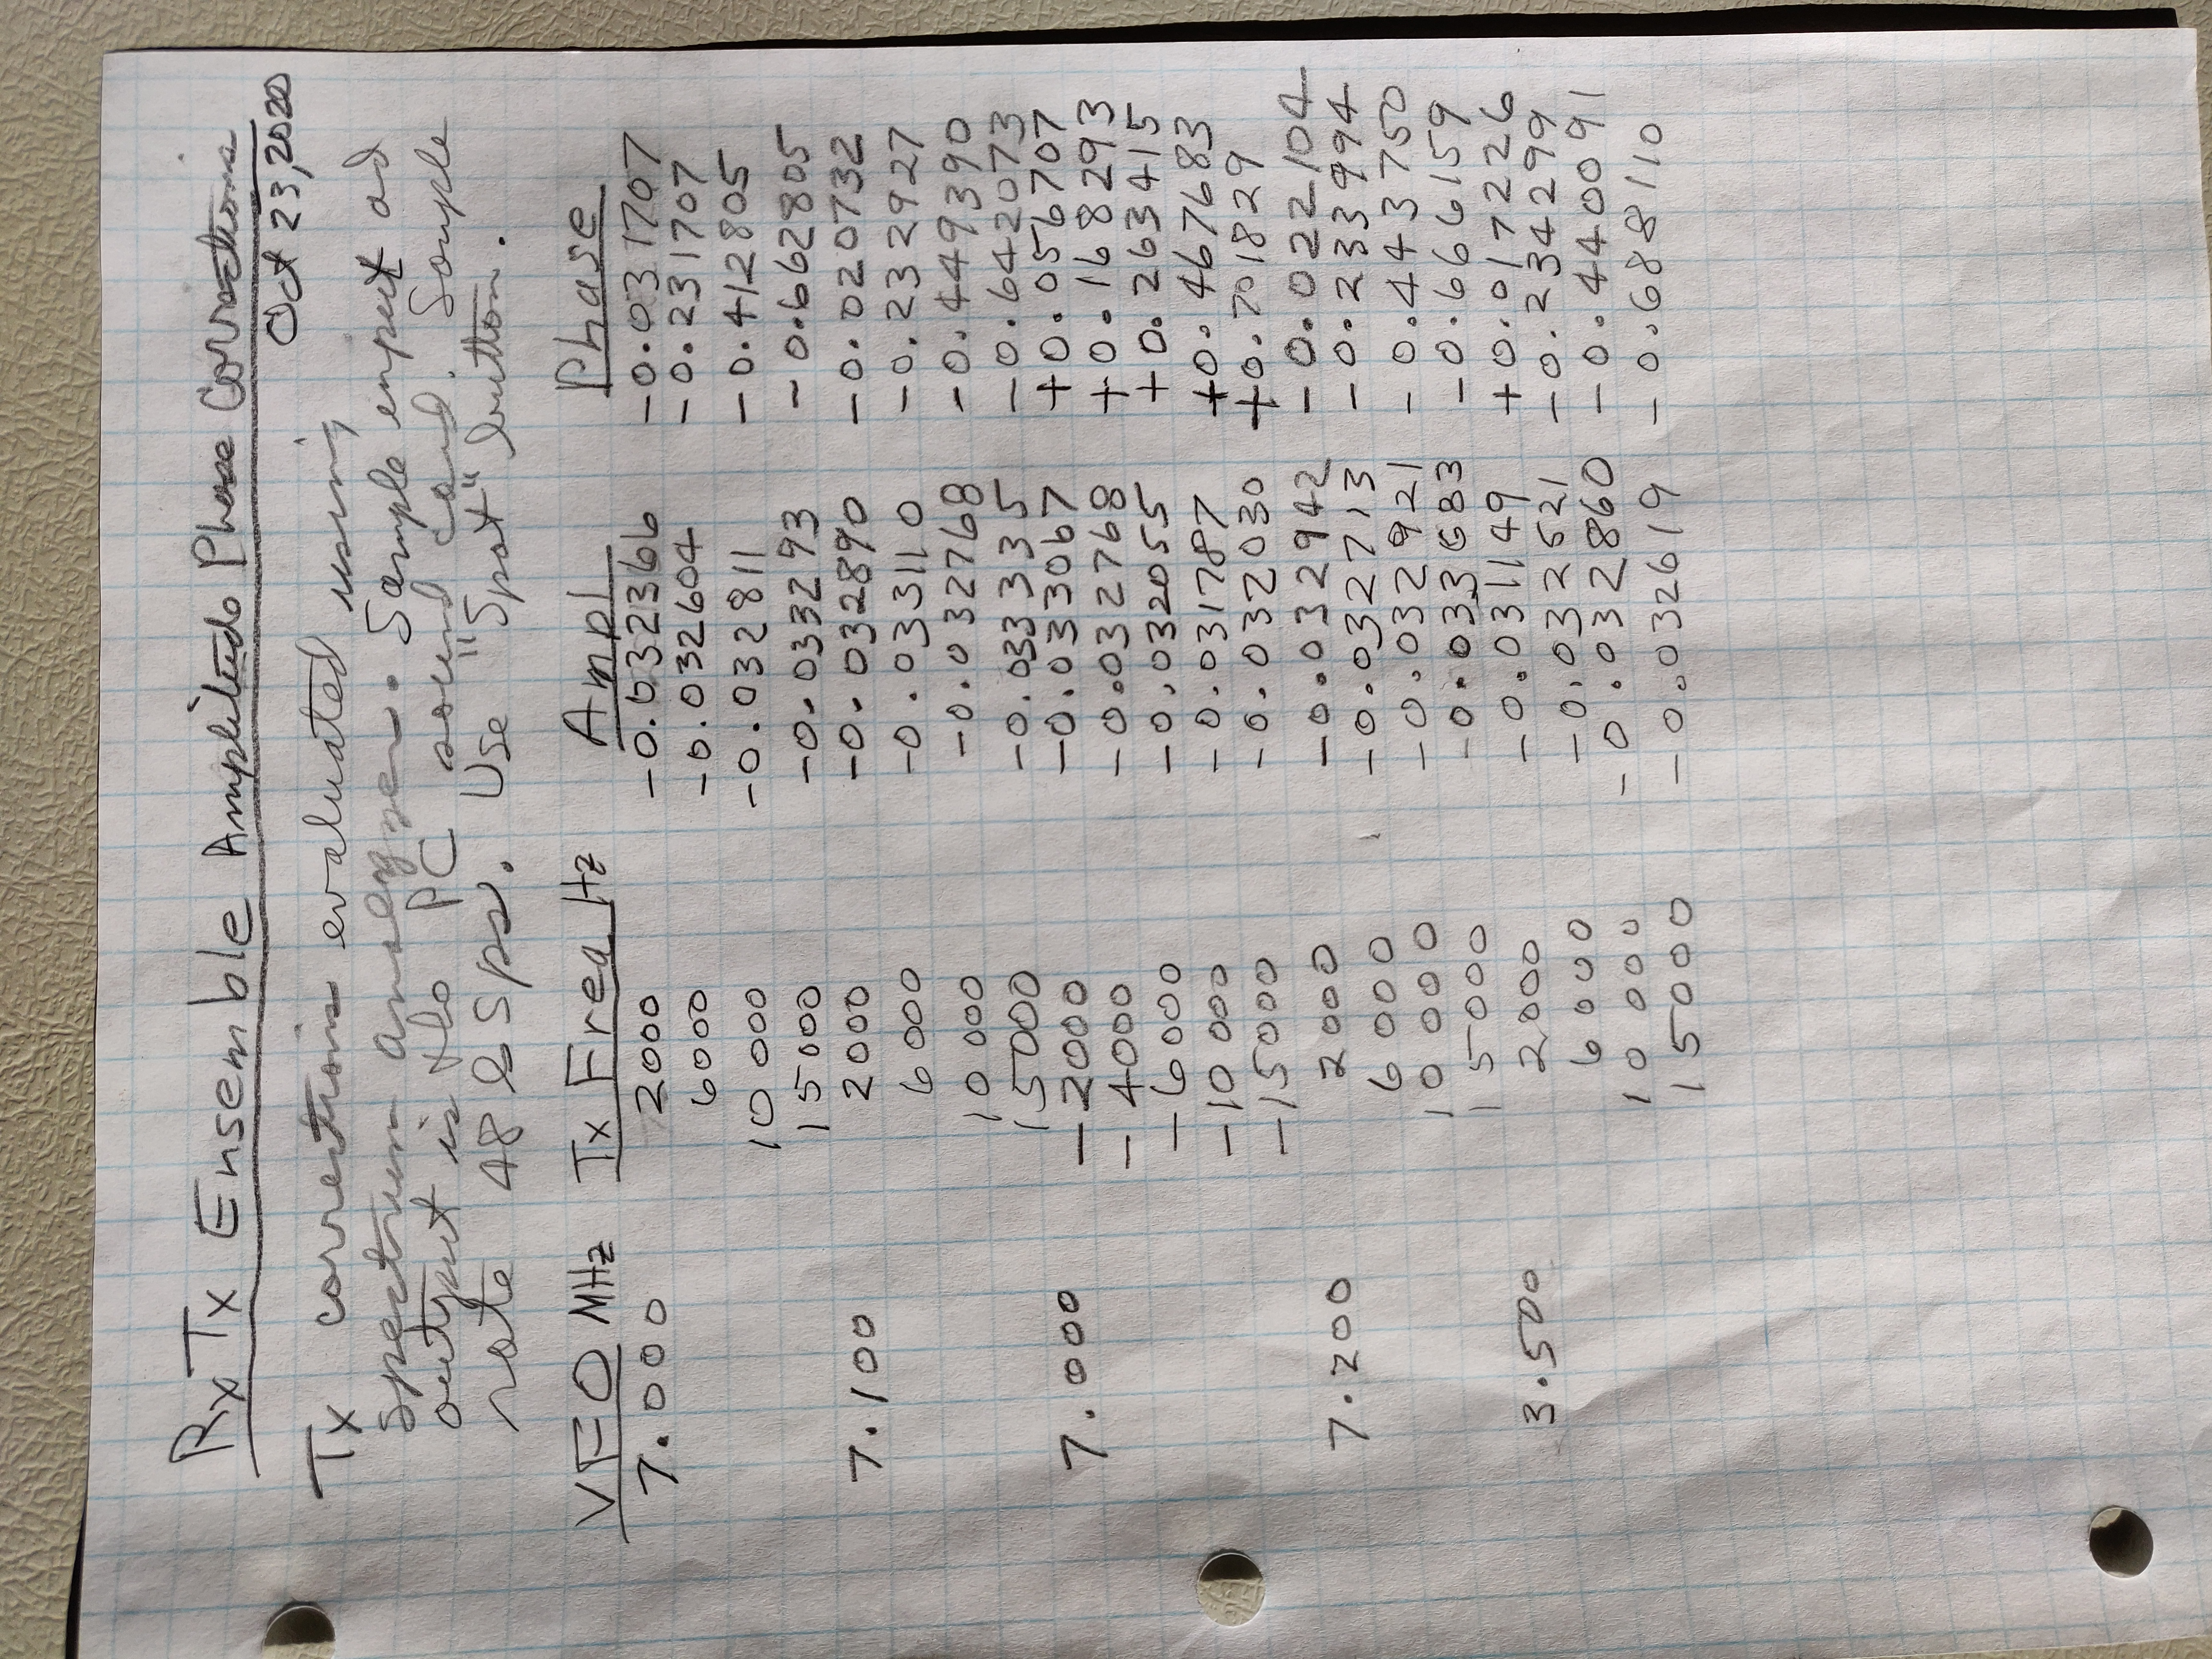
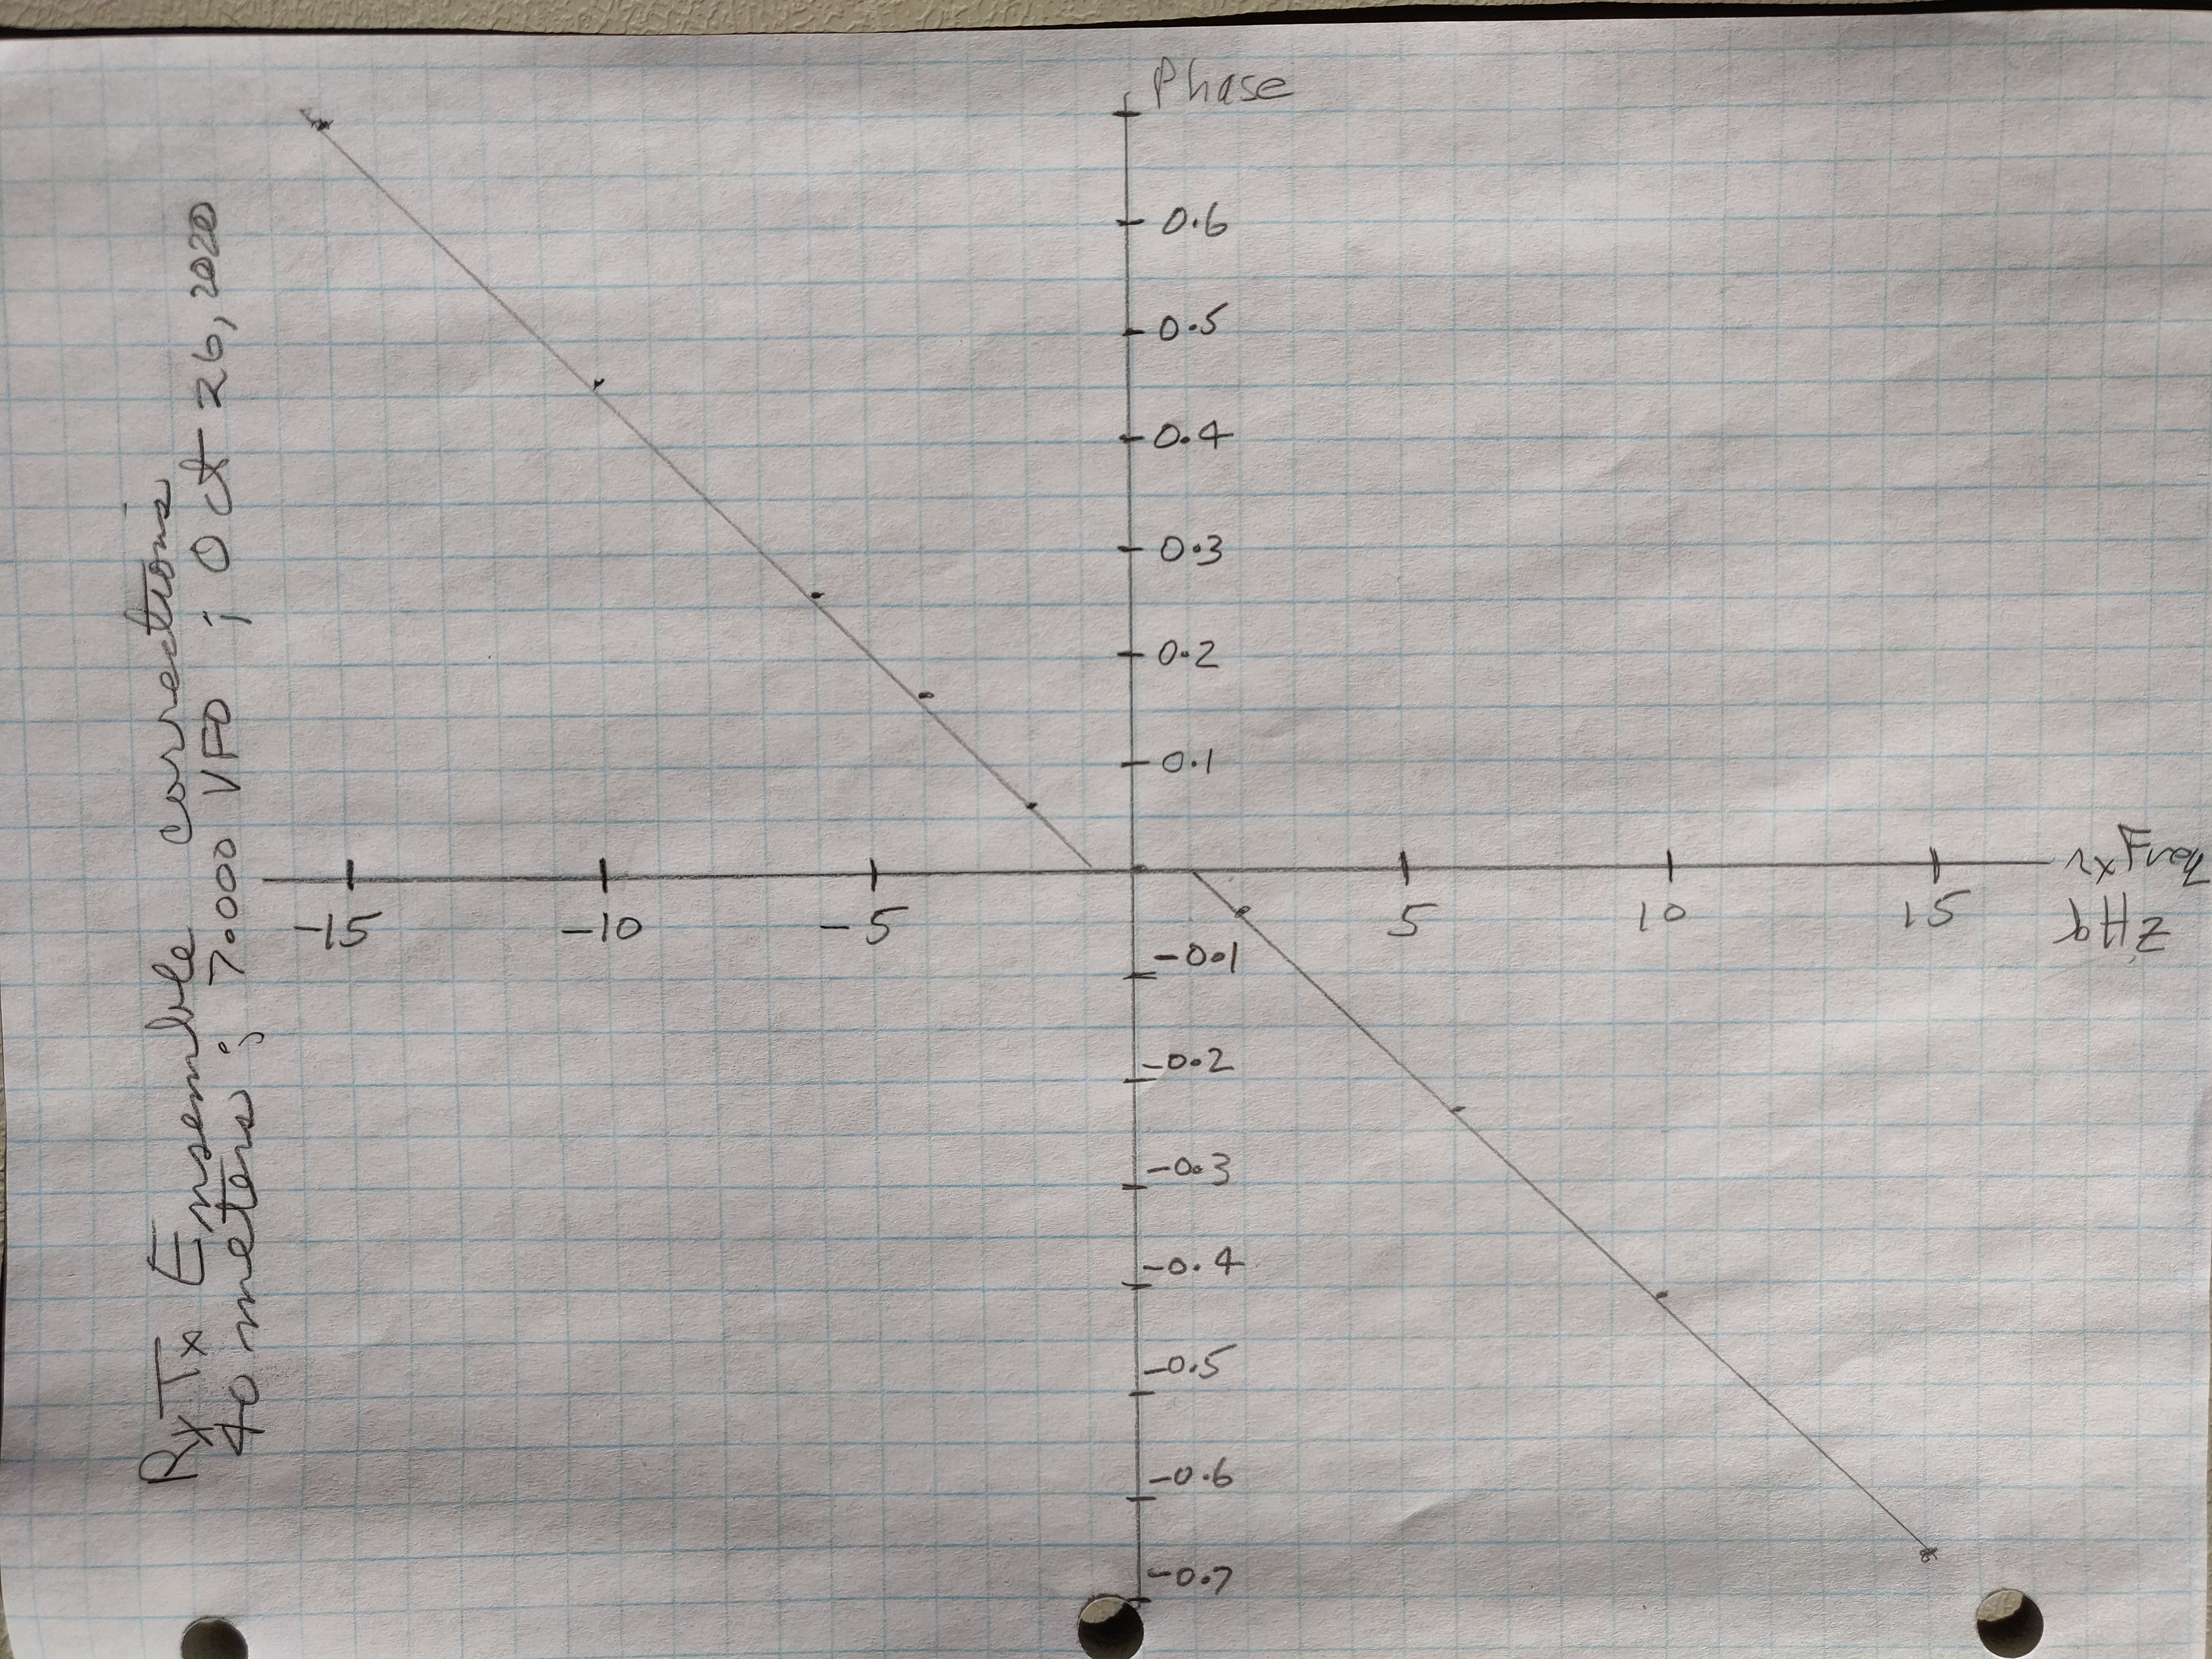
Note that the amplitude correction is almost a constant. The phase varies with both the VFO and the tuning frequency, but is most sensitive to the tuning frequency. The following graph has a fixed VFO of 7.000 MHz. The graph is quite linear, but shows a break at zero Hertz.
The above data only apply to the SoftRock Rx/Tx Ensemble, and other hardware may show different characteristics. Unfortunately, making these measurements is quite tedious unless you have a signal generator and a spectrum analyzer. Let's focus on a strategy to minimize the number of measurements. Quisk has an option to fix the offset between the VFO and the signal. Other SDR software has the same option. We could set the VFO to mid-band and make one measurement at this offset. This must be repeated for each band. A bit better is to take VFO corrections at the center and both band edges. If the VFO is fixed and the tuning offset varies, we can measure at a table of offsets, perhaps at -15000, -5000, -1000, +1000, +5000 and +15000 Hertz for a few VFO frequencies. It is important to use the same list of tuning frequencies for each VFO. Quisk will perform bilinear interpolation on both the VFO and tuning frequency.
The transmit corrections are not the same as the receive corrections. If you have a spectrum analyzer it is easy to see the image and adjust it to zero. Otherwise a second receiver tuned to the image will have to do, a tedious procedure.
Jim Ahlstrom, N2ADR